
The BOP (Balance of Power) indicator is a technical analysis tool used to assess the strength of buyers and sellers in the market. It helps traders identify potential trend reversals or confirm existing trends.
Formula for B
BOP = (Close – Open) / (High – Low)
The BOP indicator calculates the relationship between the closing price, the high price, and the low price of a given period
While there are many BOP strategies that can be traded with BOP indicator, in this post I will focus on Engulfing Bar + BOP Increase Decrease Factor
Engulfing Bar
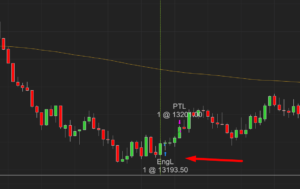
Engulfing Bar on tick based chart indicates a strong push in price action. We expect price to continue to push higher. However we know by experience not every push guarantees a continuation, price can often strongly push “Up” to the levels and continue to go in the opposite direction. Here we want to bring a filter to help us with our continuation bias.
BOP Increase Decrease Factor
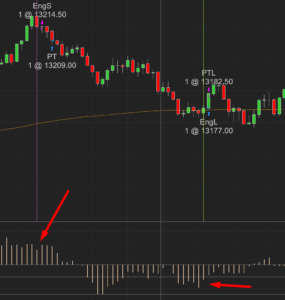
In the image above we see that BOP had a decrease of at least 20 % in the first example. Sellers got in control by pushing price to lower extremes and even by 20% . In the second example buyers pushed the price higher to new higher extremes and even increased push of at least 20% higher.
We are not interested in simple increase decrease factor we are interested in a “jump” of an increase.
Maximum Minimum BOP Readings
Another filter in BOP indicator is about having maximum or minimum of BOP readings. When reading is close to 0, we expect prices to have a counter move because there are opposite market participants at zero line. Prices close to 0 tend to osciliate around those lovels. We want to avoid trading with low BOP readings.
When BOP readings are too high, it indicates that trend is too strong and we want to avoid counter trading.
Test summary in Market Replay

Test summary in strategy analyzer.

Time period is NY Session only. NQ 800 ticks, 4/17- 6/12, 10am-3:30pm.
Total Trades 161. Long Trades 62, Percent Profitable 65%, Short Trades 99, Percent Profitable 48%
Profit Factor 1.12. Average Trades per day 4.3
We see that strategy is definetly brining more winners then losers and have a positive profit factor expectancy.
